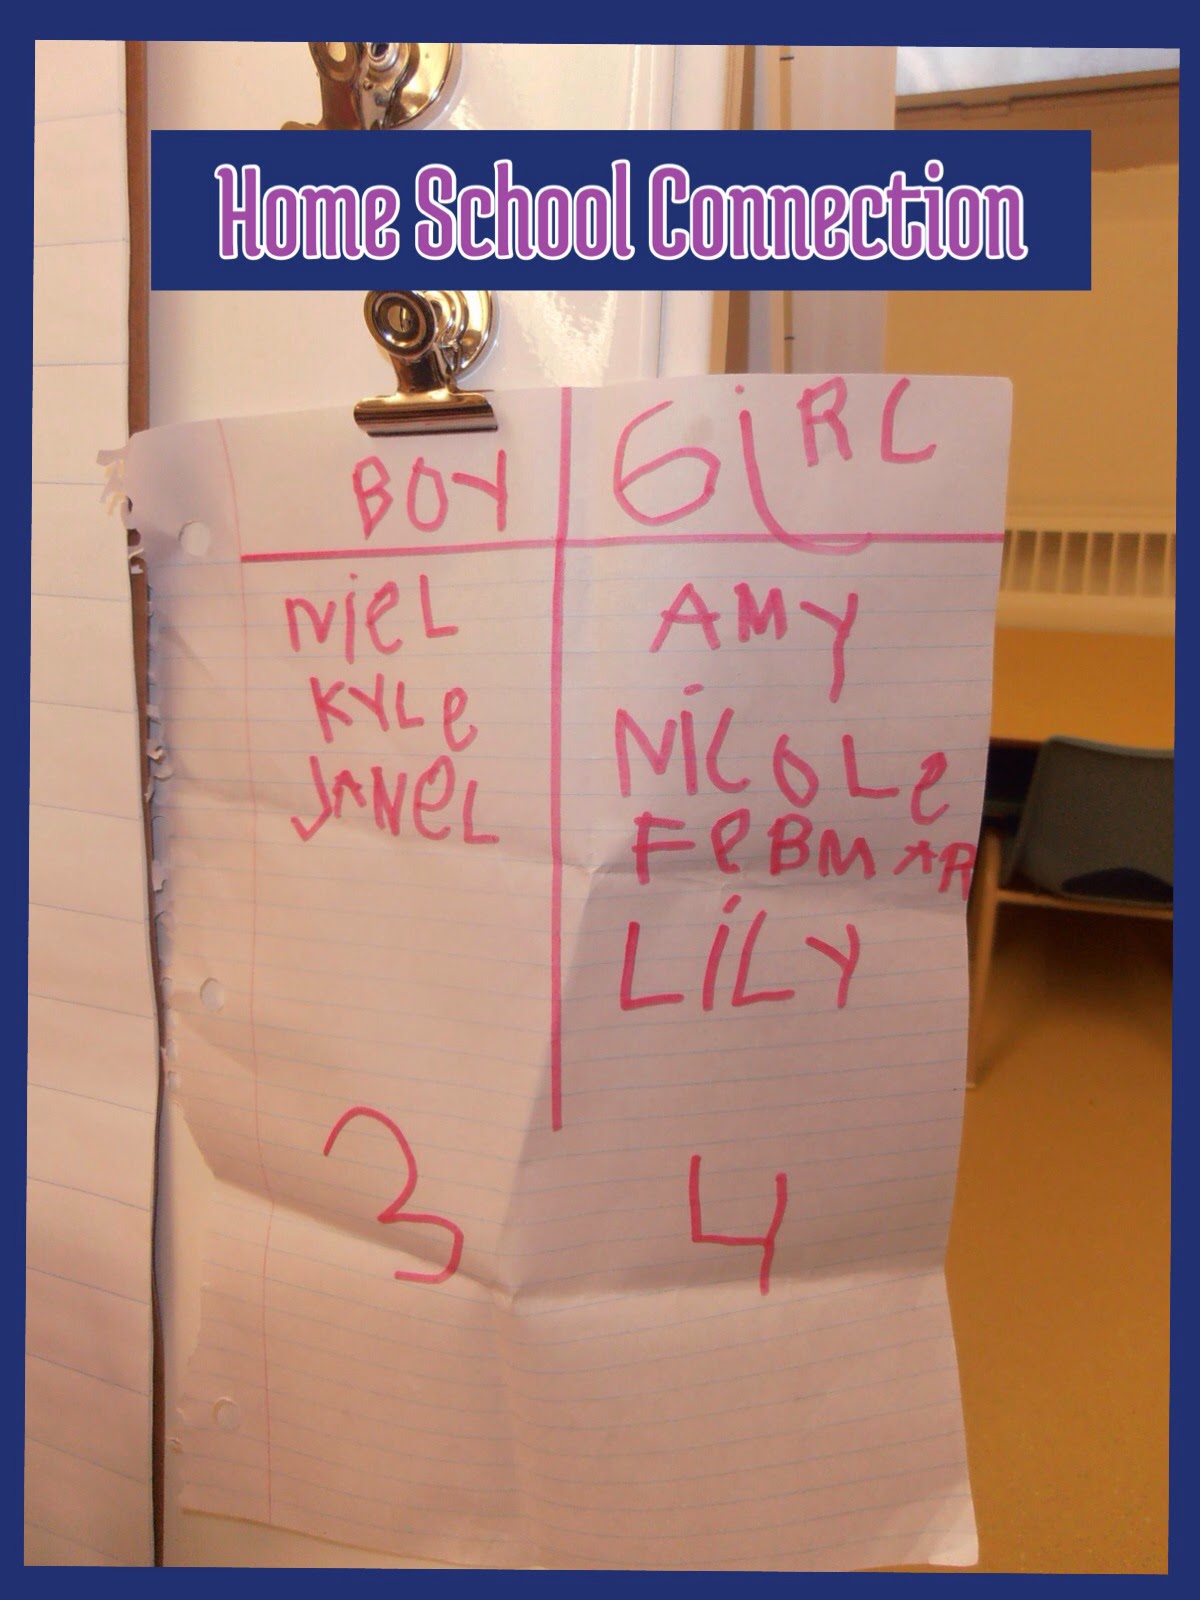
During our morning inquiry circle, we noticed that the students were always discussing whether there were more boys or girls at school that day. It happened for a few days in a row. There were lots of good attempts to count the boys and girls but there were always some disagreements as to which group had more. Then one student, K.A. thought that we should write the student's names on a chart. One student, C.G. remembered that we can make groups. She said to put the girls in one group and the boys in another group. S.B. remembered that this was called a graph. So this sparked our interest in making graphs.

When we came to school the next day, one student, K.A. had made a graph of the boys and girls who live at his house. He said that there were more girls at his house. So the girls win at his house too.


After they collected their data, they had to interpret their findings. They found out that 12 people liked cows, 8 people liked sheep, 6 people liked the giraffe and 2 people liked elephants. The students found out that the cow group was more and the elephant group was less. Then they noticed that the giraffe and sheep group could also be more, if they were compared to the elephant group. They decided that the cow group was the "Most More" group because it had the most of all the groups. Then they tried to convince Ms. Macri and Mrs. Johnston that lots of people like cows and sheep so......... we should go on a trip to the farm. Kids are so sneaky! We said we would think about it.
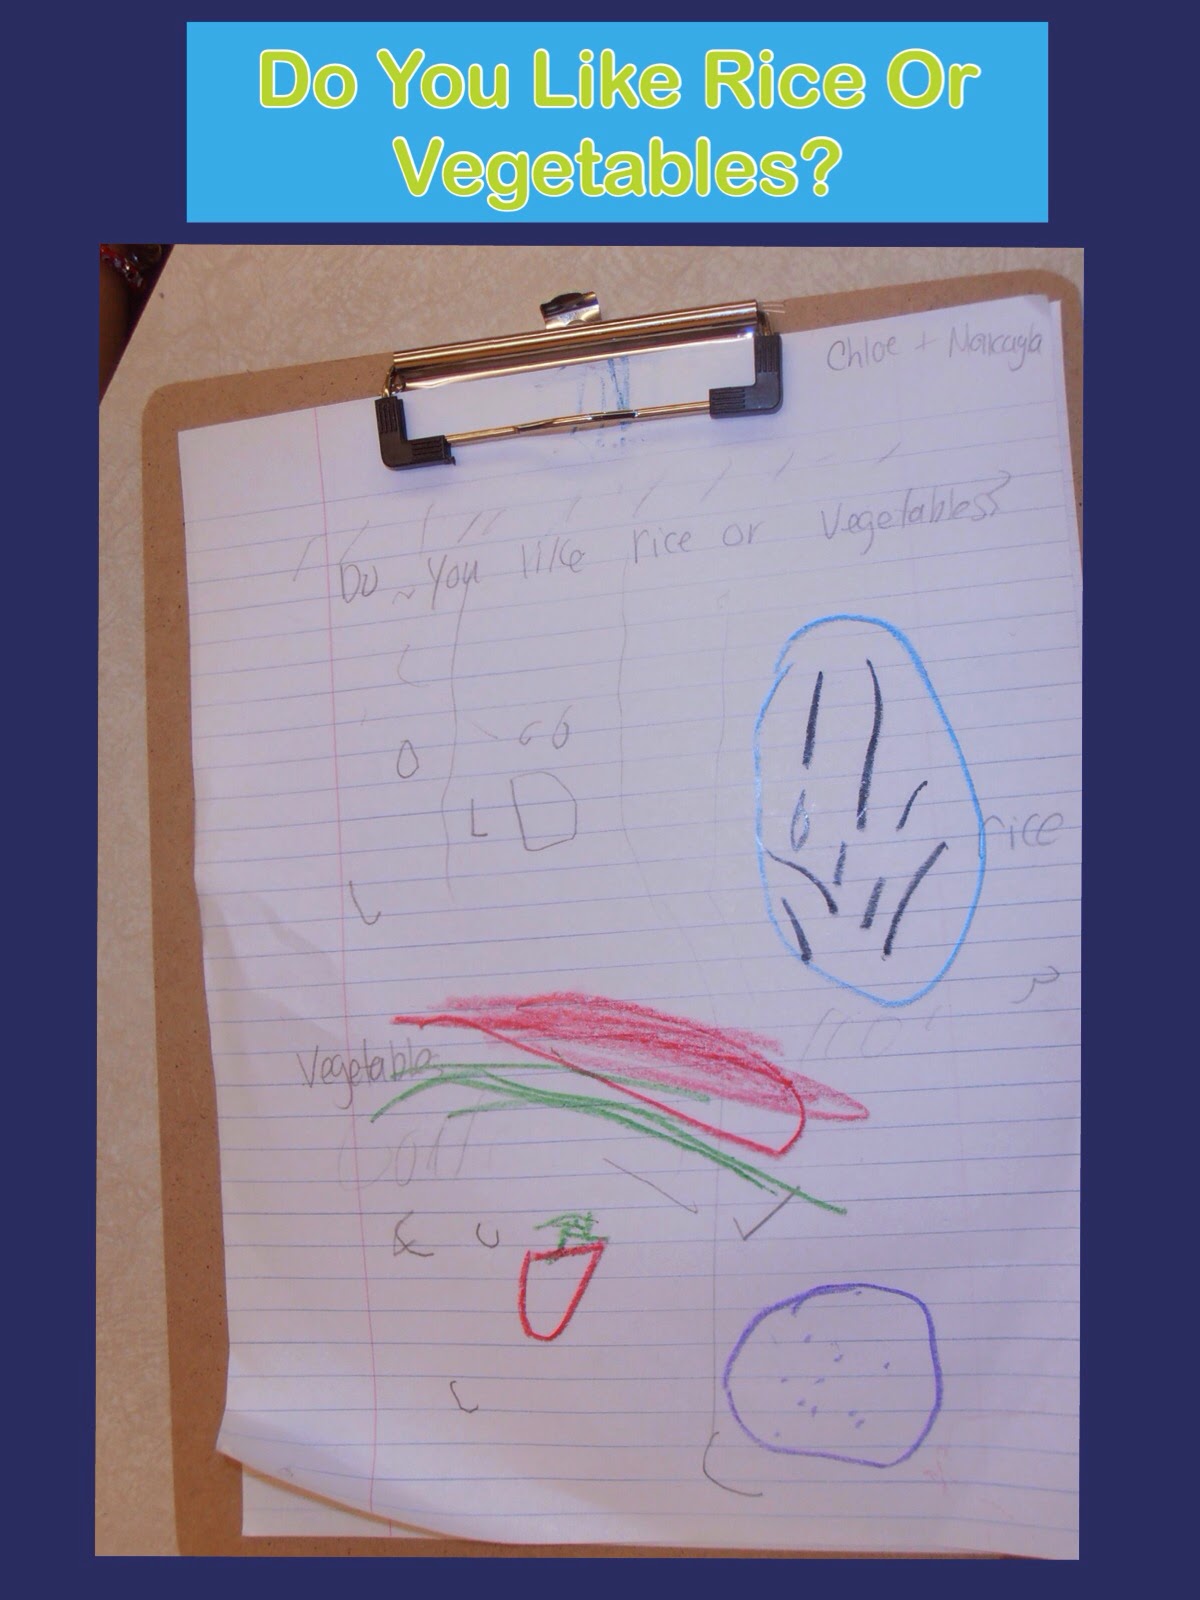
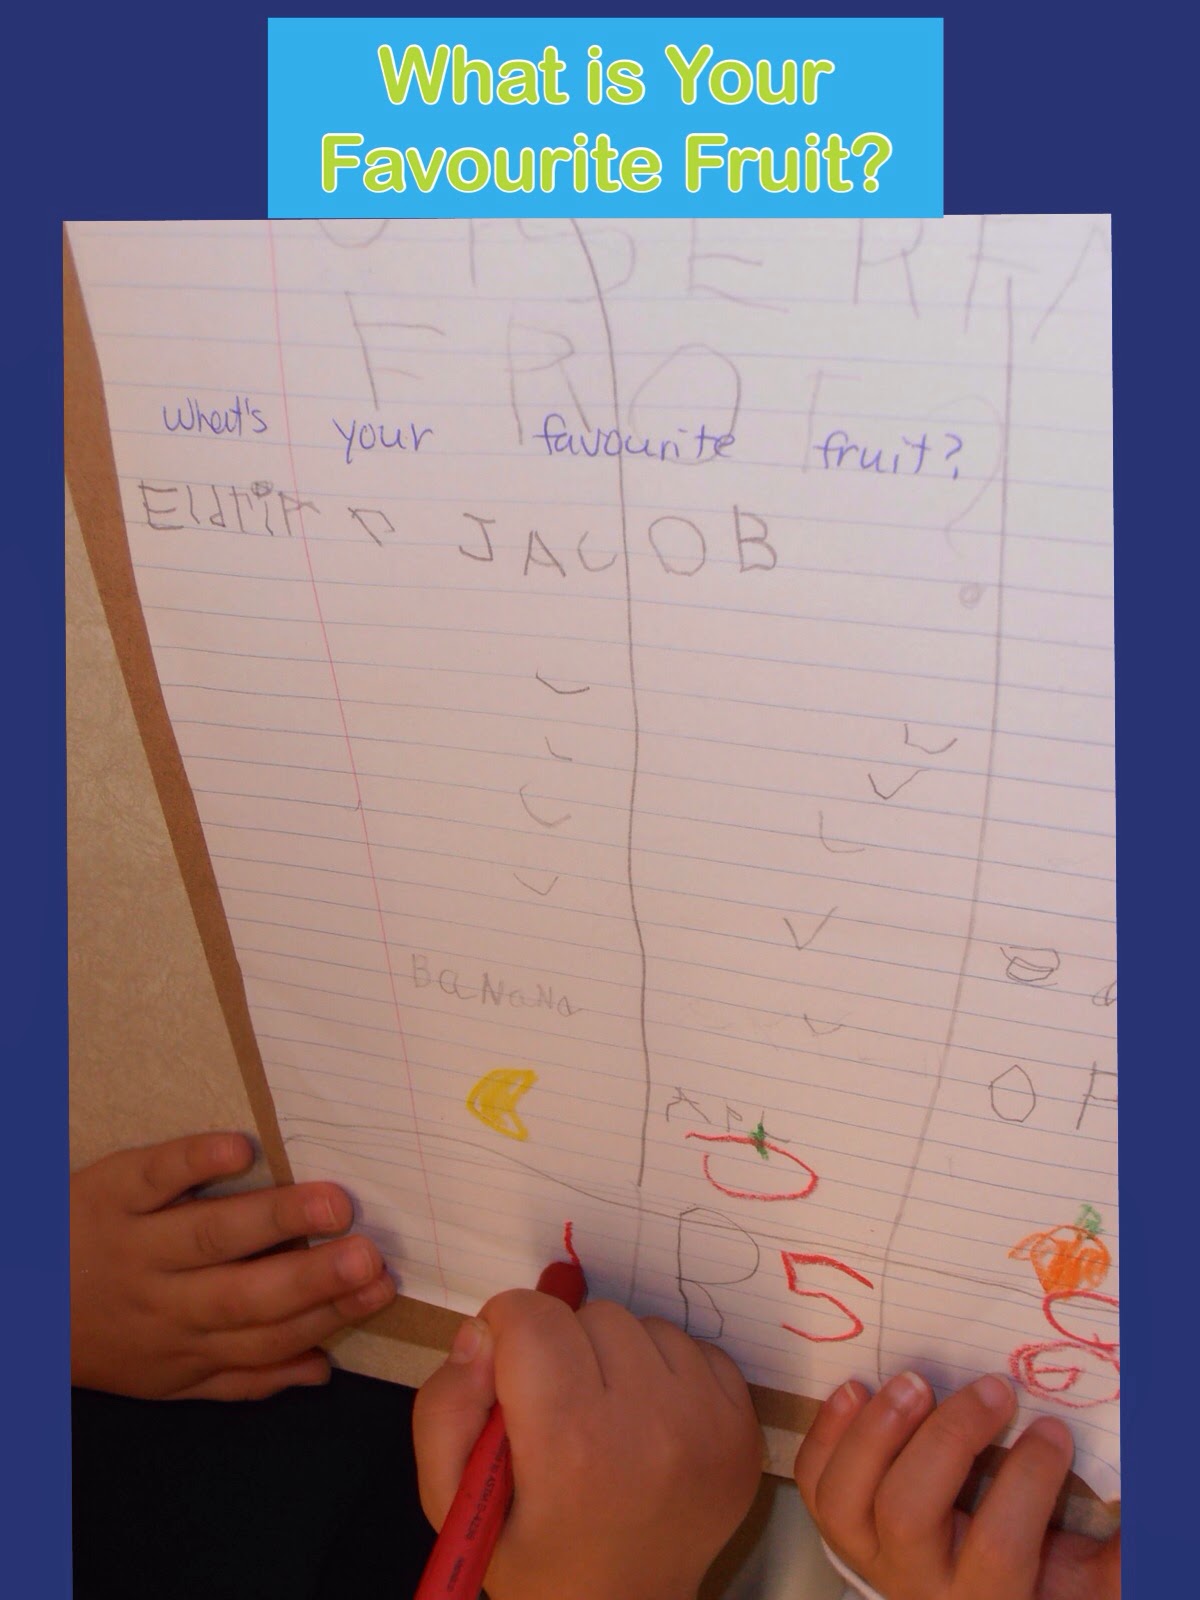
During the next few days, small groups of students began making their own graphs. They came up with a question, collected their data, sorted their data, and interpreted their data.
Here are some of our Amazing Graphs! Just a warning, if you haven't had dinner, maybe you should have a snack because these graphs will make you more hungry. I get hungry just thinking about these graphs.


These groups of students were very thorough and they asked everyone their question. As you can see, they even asked our classroom fish. Who knew fish liked spaghetti and cookies?
Here is how we documented our Graphing Journey.


* Lots of people like to eat rice.
* Everybody likes cookies (even Mrs. Johnston Mmmm!)
* More friends liked the colour purple. That is Jesus' favourite colour too.
* Pasta was our favourite food too.
* Lots of people liked fruit but they like oranges the best.
Dear Parents,
Now you know what kinds of foods and snacks we like to eat. Don't forget to pack our lunch with our favouites!
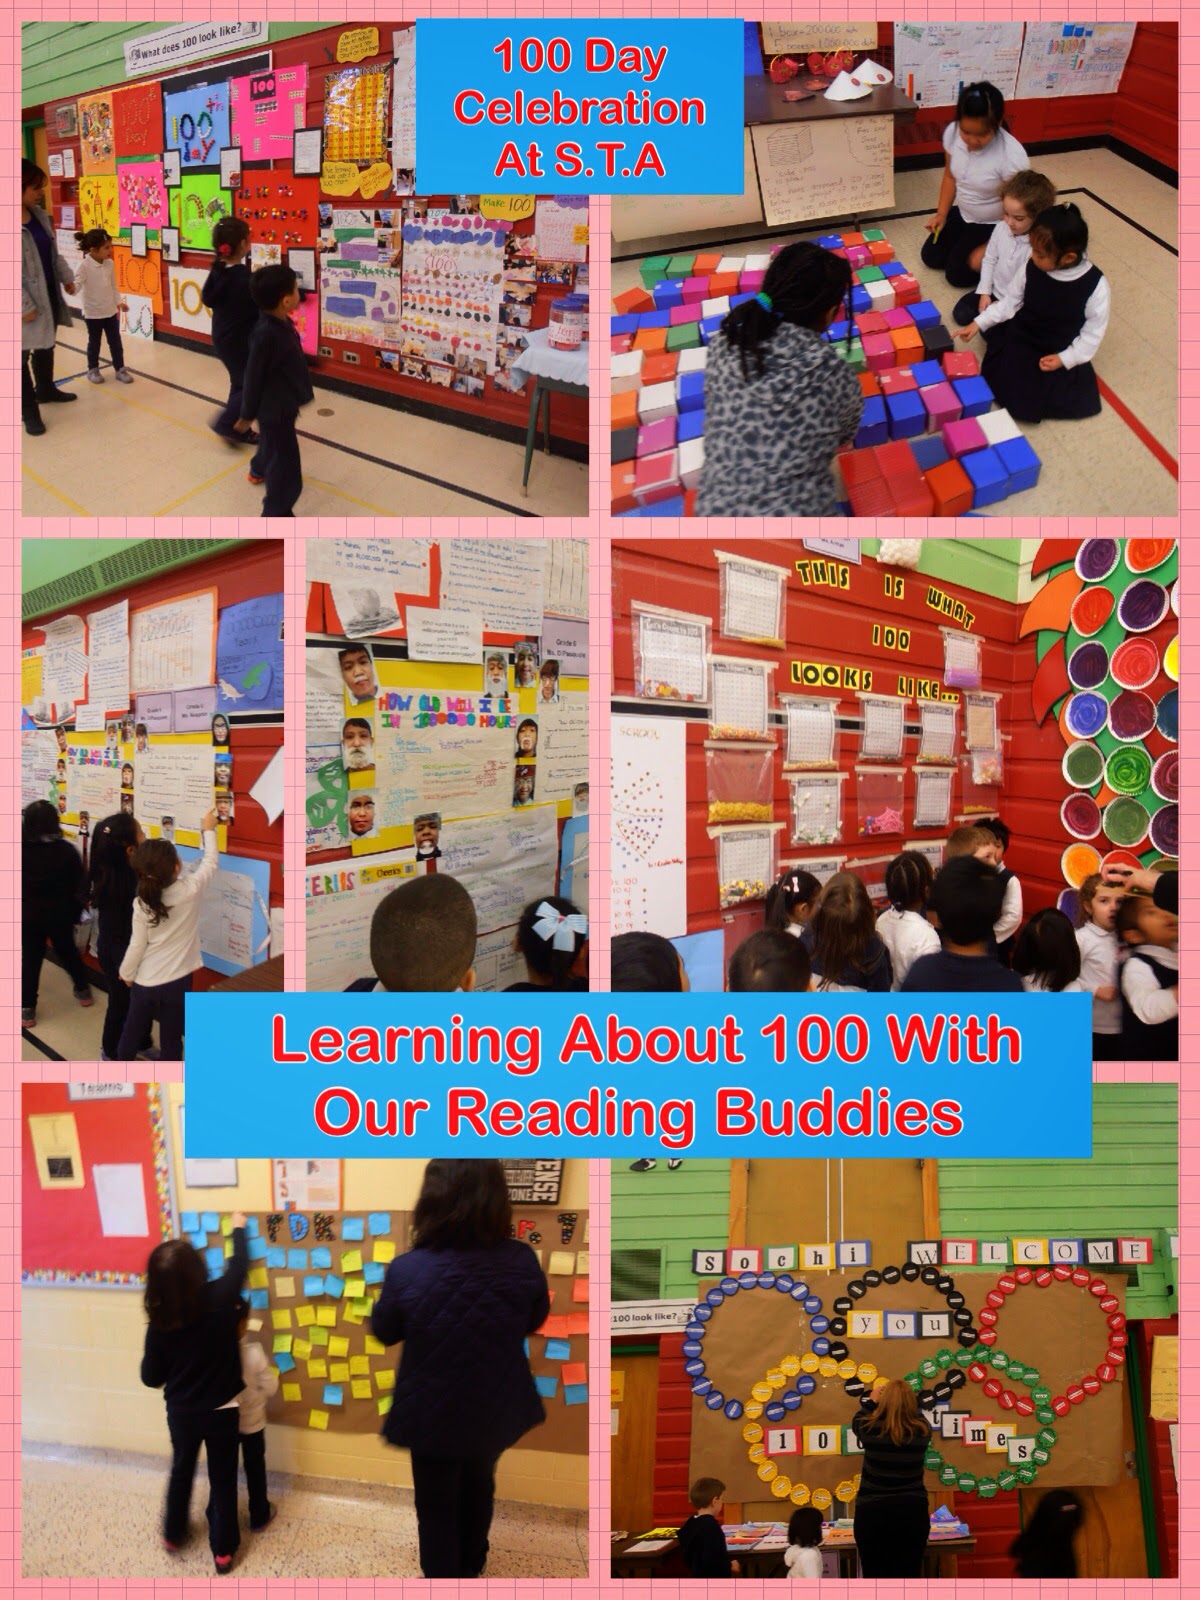
PART 2: WHAT DOES 100 LOOK LIKE?

One day at our morning inquiry circle, the students noticed that there was a new chart on the board. There was lots of conversation about what it was and why it was there. They saw lots of numbers on it. Some students started to count out loud all of the numbers starting with number 1. It took a long time but they counted all the way to 100. Some students noticed that the numbers in each line going across all began with the same number. They also noticed that the numbers in the row going down also have the same number but at the end. Mrs. Johnston told us that this chart was called a HUNDRED CHART. Then she told us that the whole school was going to be studying the number 100. The whole school was going to do a "100" inquiry. We were all excited about investigating all about 100. We know that the first thing to do in an inquiry is to talk about what we already know. So we made a chart about what we know about the number 100.

G.C: You can count all the way to 100.
J.F: You have to count from 1 to 100, all the way.
E.C: It's a biggest number.
M.W: You can draw 100, draw all the way to 100.
C.G: You can count 100 animals.
J.A: You can count 100 people.
A.S: You can count 100 beats.
K.A: 100 cars
K.D: You could count 100 airplanes.
M.A: You can make 100 circles.
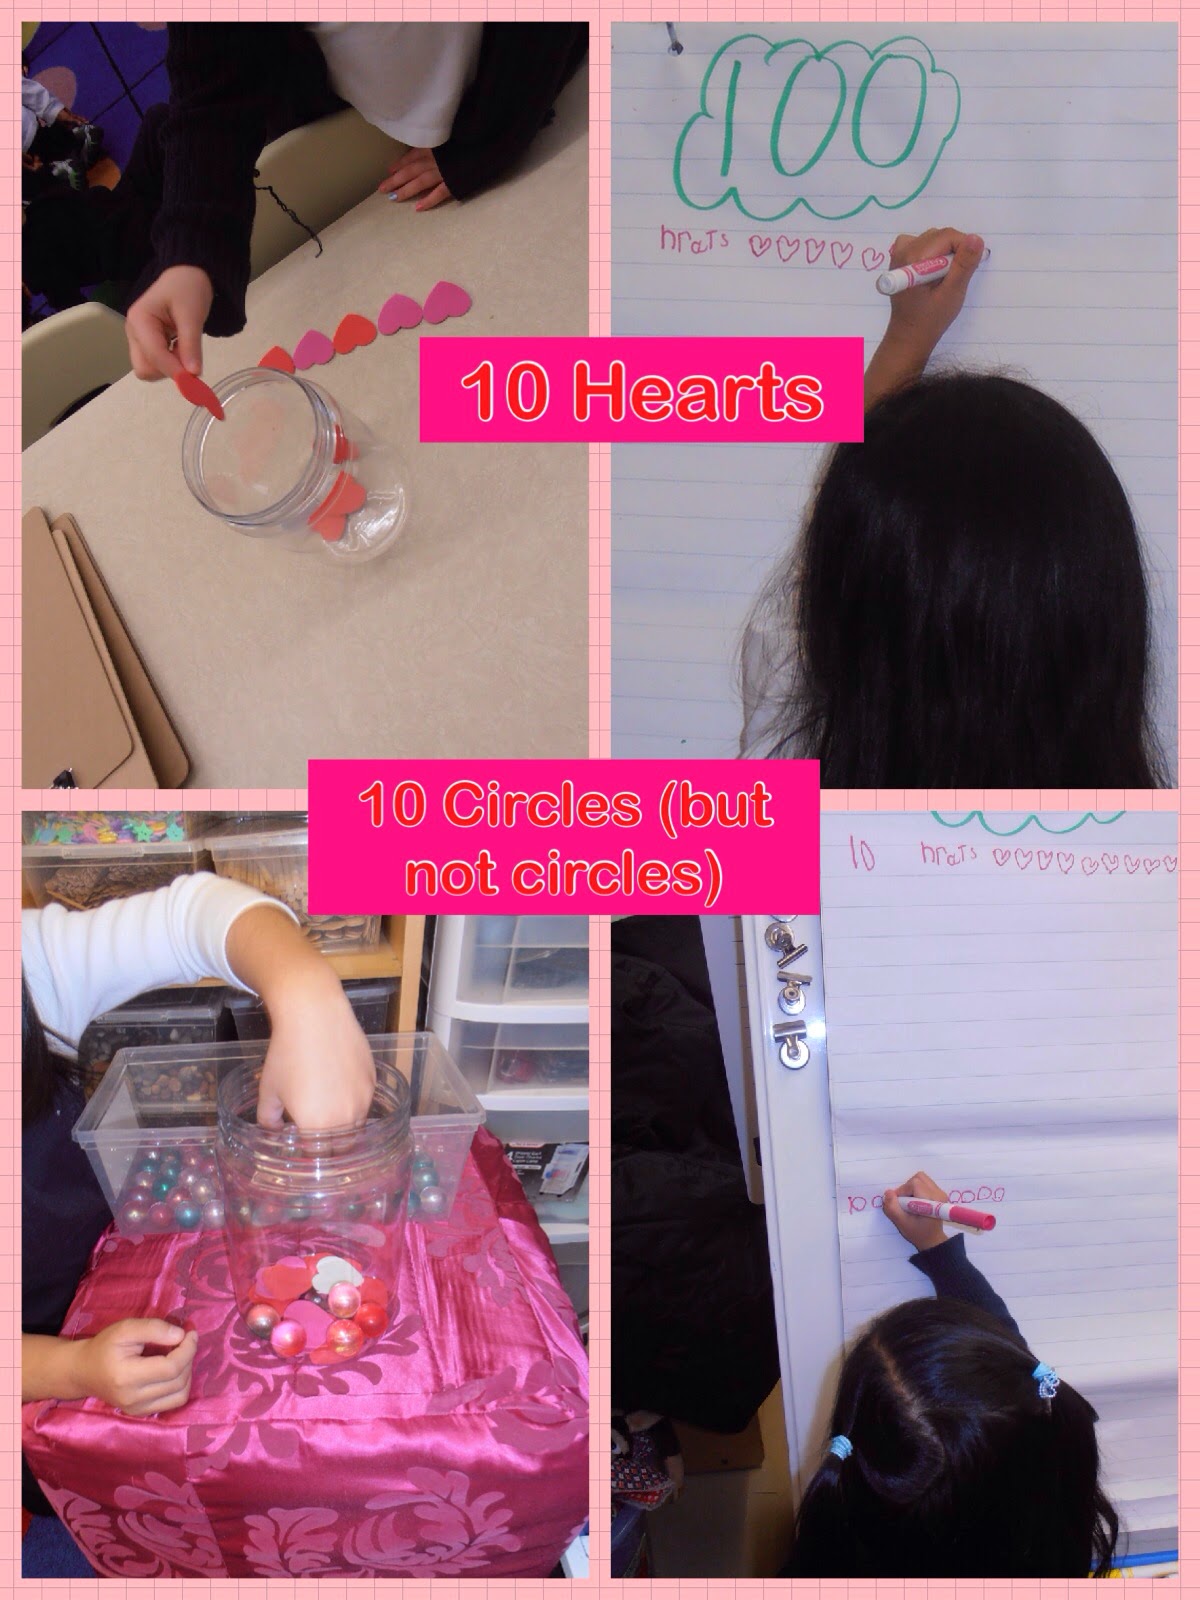
* We all agreed that we should start by making 100 CIRCLES.
* We didn't know where to start. One student G.S said "We can make different coloured circles." Then G.C. thought that we should get a partner and work together. So that is where we started. The students wanted to make their 100 chart look like the 100 chart that was on display.
* Each group cut out 10 circles and glued them on our 100 chart. They counted and wrote the numbers underneath their circles.
Team Light Purple: C.C and S.B Team Blue: C.B., A.A and G.C


Team White: K.A and M.W. Team Brown: A.S and E.L.


Team Pink: M.A and G.S. Team Dark Purple: J.A and K.D.


Team Orange: A.G. and A.P. Team Black: E.C. and M.O.


Team Yellow: C.S., A.I. and J.F. Team Red: R. G. and C.G.


We did it! Wow, making 100 takes lots of TEAMWORK! We had to make 10 groups of 10.


Now our Friends wanted to collect 100 things and put them in a jar. So they set out to find items to put into the jar. They counted 10 groups of 10.


Then our Grade 5 Buddies came to our class and they showed us other ways to make 100. We found out that you can make 1 Group of 100 and 4 Groups of 25. We worked together to make these 100 jars. Our Buddies are so SMART!


We even made a 100 jar with our family during our Family Open House event. We showed our parents how we can count all the way to 100.
Then we displayed all of our learning about 100 in the gym for all of our friends to see. Every class had so many different ways to show 100 and even bigger numbers. We even saw
1 MILLION! Now that is a big number.

We had many jars with 100 things inside. Some students started to wonder how all of the jars could all have 100 things inside. Some of the jars looked empty and some of the jars looked full. How can they all be 100? Some students even recounted to items to make sure that there were 100 things in the jar. But there were 100 things in all of the jars. They decided that they needed to talk about it with their friends. So we gathered for an inquiry circle to discus their findings. Everyone looked at the jars. Some students shook the jars. Then one student (E.L.), said that the rocks are very small. Then other students (B.D and C.G.) added that the hearts are very skinny and flat. We asked the students: How can all of these jars contain 100 things? We noticed that one of the jars had big, fat things in it and it was very full. The students began to come up with some theories that if you put 100 small things in a jar, it takes up less space and if you put 100 big things in a jar, it takes up more space. But the most important observation was that they all can still be 100. 100 can be big or small depending on what you put in the jar. This was an amazing team discovery process and supports the need to allow student discovery time and not to give all of the answers to the students but let them work out the problem themselves. This way the learning is more powerful and more meaningful.


Then one day during inquiry activities, one friend put some Lego blocks in a jar and asked some other friends if they thought that there were 100 Lego blocks in the jar. They had a long discussion and before we knew it, many of the students were making a guess. Some thought that there were 100 Lego blocks and some thought that there were not 100 Lego blocks in the jar. We learned that when we make a guess about how many, it is called ESTIMATION. We decided to write down our guesses, I mean estimates, and then count the Lego blocks to see whose estimate was the closest.

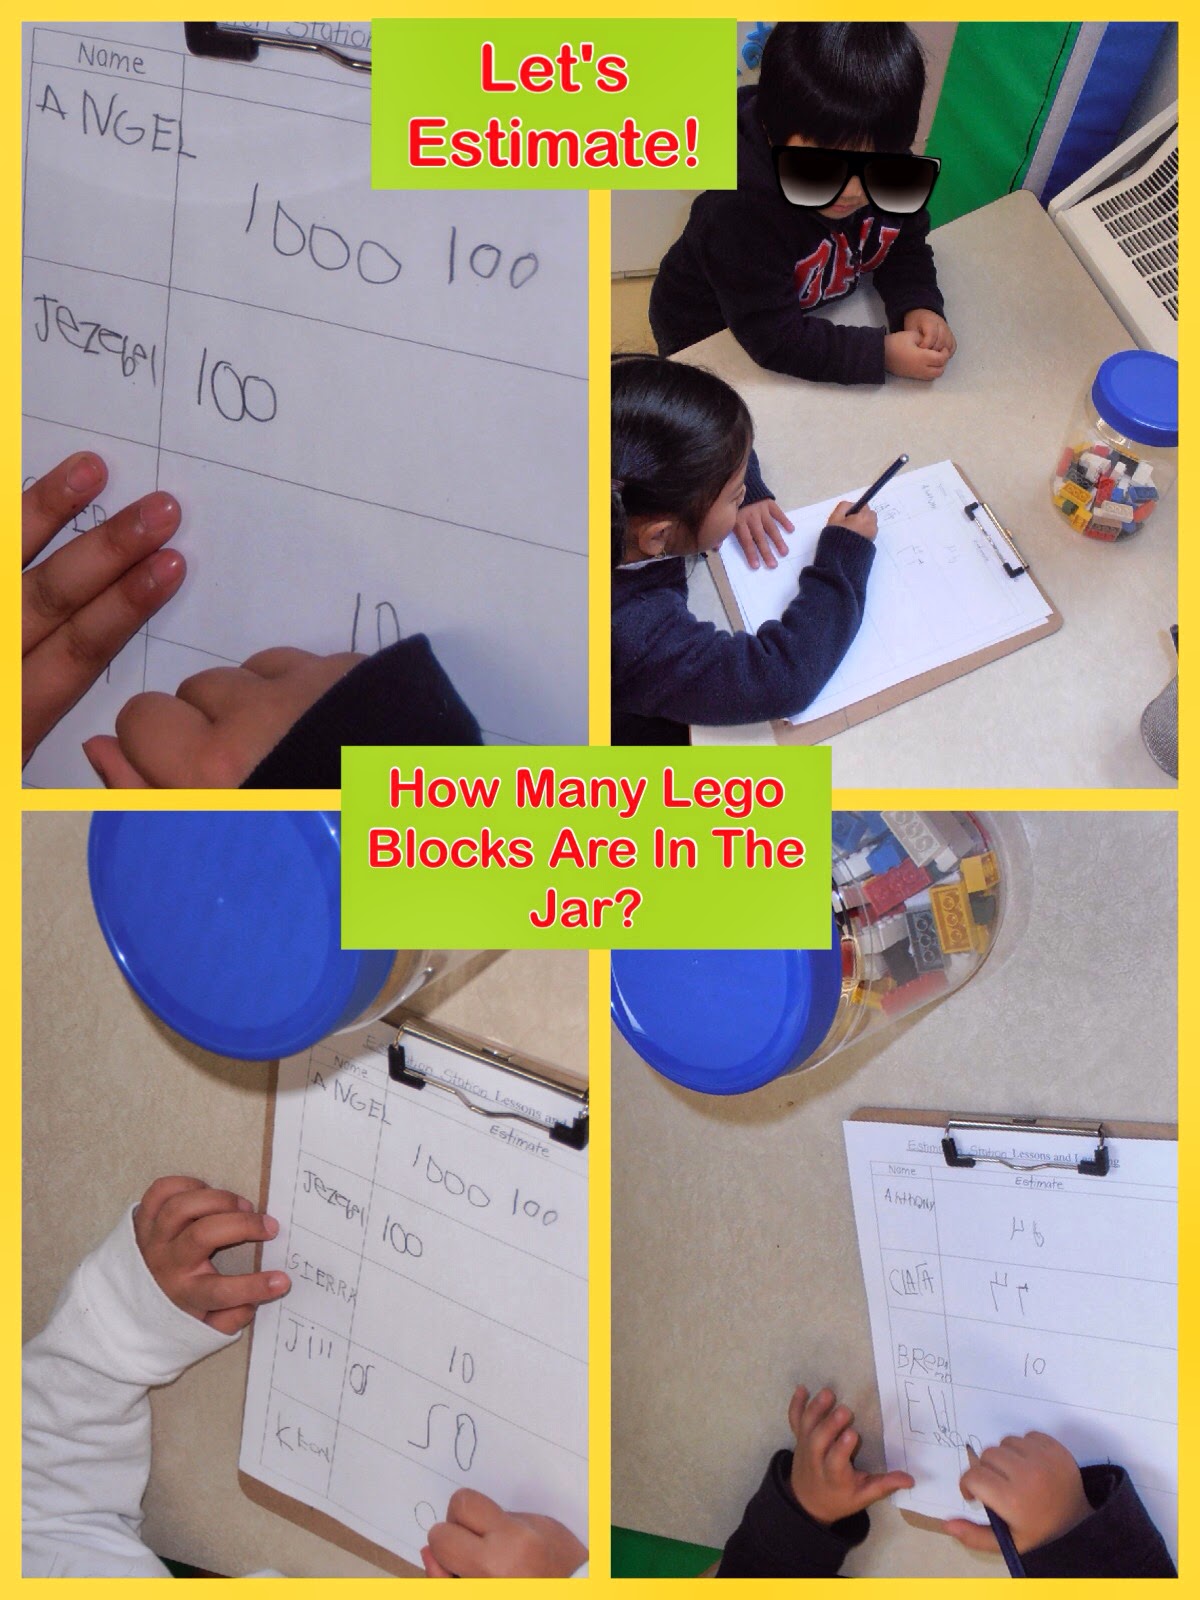
The next day we counted the Lego blocks. We found out that there were 52 Lego blocks in the jar. That is less than 100. We compared it to a jar of 100 things. Then the next day we found a basket of markers and wondered how many markers were in the basket. Everyone made an estimate, then we counted the markers. There were 20 markers. This sparked our ESTIMATION INQUIRY. We wanted to keep on estimating. We decided to make an ESTMATION STATION.


We estimated with cotton balls. We estimated acorns with our Buddies. We even estimated with our parents at our Family Open house.


Ms. Macri and Myself always enjoy this journey together with our Little Friends. It is amazing how much you can "See" when you take the time to listen, provoke and not give all of the answers. Inquiry learning is truly infectious!
